
Development of selected financial data
Net revenue, service revenue a
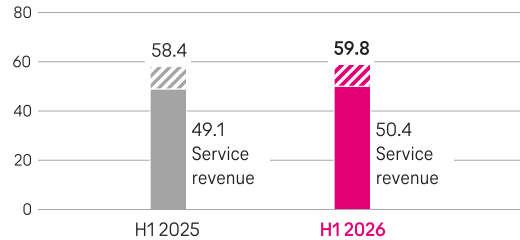
Net revenue increased by 2.4 % to EUR 59.8 billion. In organic terms, net revenue increased by 4.0 %.
Service revenue was up 2.8 % to EUR 50.4 billion. In organic terms, service revenue increased by 3.9 %.
All operating segments (with the exception of Group Development) contributed to the growth in revenue. This growth was mainly driven by higher service revenues, higher terminal equipment revenues in the Germany and United States operating segments, and growth in the Digital area of the Systems Solutions operating segment.
The main reducing factors were negative exchange rate effects in the United States operating segment.
billions of €
EBITDA AL (adjusted for special factors)
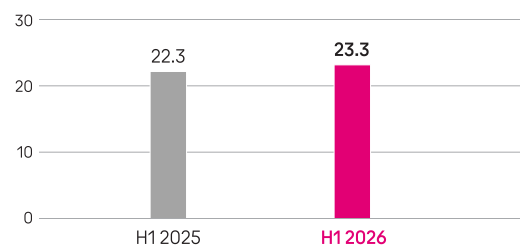
Adjusted EBITDA AL grew by 4.7 % to EUR 23.3 billion. In organic terms, it increased by 7.4 %.
All operating segments (with the exception of Group Development) contributed to the increase, which was driven by the sound revenue trend and the realization of cost efficiencies.
The adjusted EBITDA AL margin increased to 39.0 %. The adjusted EBITDA AL margin was 41.8 % in the Germany operating segment, 40.0 % in the United States operating segment, and 39.2 % in the Europe operating segment.
billions of €
Profit/loss from operations (EBIT)
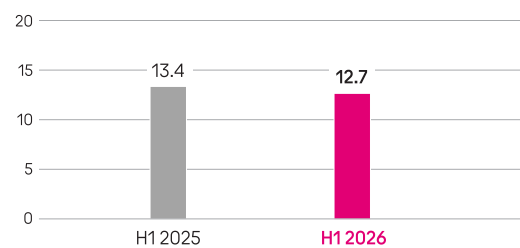
EBIT declined by EUR 0.7 billion to EUR 12.7 billion.
At EUR 1.6 billion, special factors affecting EBITDA AL – mainly in the United States operating segment – were up by EUR 1.4 billion. Expenses incurred in connection with staff-related restructuring measures increased by EUR 0.5 billion. Other special factors increased by EUR 0.5 billion. Depreciation of and impairment losses on right-of-use assets recognized as a special factor increased by EUR 0.3 billion.
EBITDA AL decreased by EUR 0.3 billion to EUR 21.7 billion.
Depreciation, amortization and impairment losses increased by EUR 0.6 billion to EUR 12.4 billion. Depreciation and amortization expense increased primarily due to assets acquired in the UScellular Acquisition and the continued build-out of 5G.
billions of €
Net profit (adjusted for special factors)
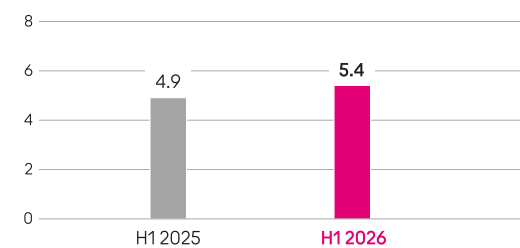
Adjusted net profit increased by EUR 0.4 billion to EUR 5.4 billion.
Adjusted earnings per share rose by 10.3 % to EUR 1.12.
Unadjusted net profit decreased by EUR 1.0 billion to EUR 4.5 billion.
Loss from financial activities increased by EUR 1.0 billion to EUR 3.2 billion, due to the decrease in the profit from associates and joint ventures included in the consolidated financial statements using the equity method. The prior year had included in particular the positive effects of reversals of impairment losses on our investments in GD Towers and GlasfaserPlus.
billions of €
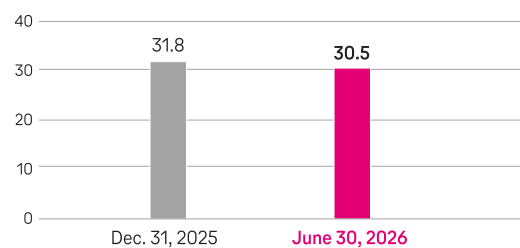
Equity ratio
The equity ratio decreased to 30.5 %. Shareholders’ equity decreased by EUR 3.4 billion to EUR 88.8 billion, while the total assets/total liabilities increased by EUR 1.6 billion to EUR 291.3 billion, primarily due to exchange rate effects.
Shareholders’ equity was reduced in particular by transactions with owners (EUR 6.3 billion), mainly in connection with the share buy-backs at T‑Mobile US. Dividend payments to our shareholders (EUR 4.8 billion) and to other shareholders of subsidiaries (EUR 1.2 billion), as well as the share buy-backs at Deutsche Telekom AG (EUR 1.0 billion) also reduced shareholders’ equity.
The main factors increasing shareholders’ equity were profit of EUR 6.9 billion, as well as other comprehensive income of EUR 2.6 billion, which included positive exchange rate effects.
%
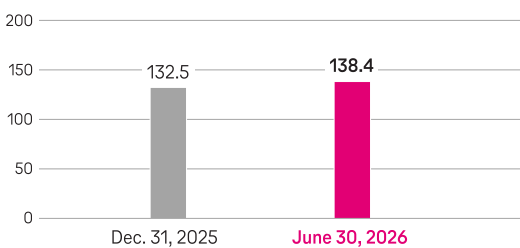
Net debt b
Net debt increased by EUR 5.9 billion to EUR 138.4 billion.
The main factors increasing net debt were the share buy-backs at T‑Mobile US (EUR 6.1 billion) and dividend payments – including to non-controlling interests (EUR 5.8 billion). Exchange rate effects (EUR 2.9 billion), additions of lease liabilities and of right-of-use assets (EUR 2.1 billion), and the share buy-backs at Deutsche Telekom AG (EUR 1.0 billion) also increased net debt.
Net debt was reduced by free cash flow (before dividend payments and spectrum investment) of EUR 13.4 billion.
billions of €
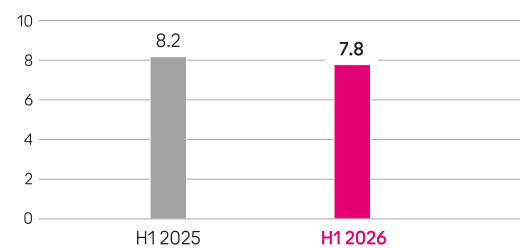
Cash capex (before spectrum investment) c
Cash capex (before spectrum investment) decreased by EUR 0.4 billion to EUR 7.8 billion.
Cash capex in the Germany operating segment decreased by EUR 0.5 billion, mainly on account of the timing of investments in the fiber build-out. In the United States operating segment, cash capex increased by EUR 0.1 billion, in particular due to higher investments in the continued network build-out and the UScellular Acquisition in the prior year. By contrast, exchange rate effects reduced the amount of the cash outflows in the reporting currency.
Cash capex (including spectrum investment) decreased by EUR 0.8 billion to EUR 8.4 billion. EUR 0.5 billion in total was invested in mobile spectrum licenses in the reporting period in the United States and Europe operating segments. In the prior-year period, EUR 1.0 billion had been invested in mobile spectrum licenses.
billions of €
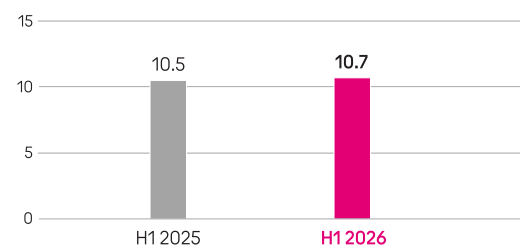
Free cash flow AL (before dividend payments and spectrum investment) c, d
Free cash flow AL was up by EUR 0.2 billion to EUR 10.7 billion.
This was attributable to the strong development of the operating business and lower cash capex (before spectrum investment).
Exchange rate effects, higher tax and net interest payments, higher cash outflows relating to the 2025-2026 Workforce Transformation and corporate transactions agreed in the prior year in the United States operating segment, and higher cash outflows for the repayment of lease liabilities decreased free cash flow AL.
billions of €
For a reconciliation for the organic development of key figures for the prior-year period, please refer to the section “Additional information.”
For further information, please refer to the sections “Development of business in the Group” and “Development of business in the operating segments” in the interim Group management report, and to the IR backup on our Investor Relations website.
For further information on our performance indicators and alternative performance measures, please refer to the section “Management of the Group” in the 2025 combined management report (2025 Annual Report) and our Investor Relations website.
a aAs of January 1, 2026, the definition of service revenue was changed. The prior-year comparative was adjusted retrospectively.
b bIncluding, where it exists, net debt reported under assets and liabilities directly associated with non-current assets and disposal groups held for sale.
c cExcluding cash outflows for investments made by T‑Mobile US to acquire customer bases.
d dExcluding proceeds from the disposal of spectrum due to the sale of spectrum licenses by T‑Mobile US.