
Financial position of the Group
millions of € |
|
|
|
|
|
||||
|
June 30, 2026 |
Dec. 31, 2025 |
Change |
Change |
June 30, 2025 |
||||
|---|---|---|---|---|---|---|---|---|---|
Bonds and other securitized liabilities |
94,881 |
91,980 |
2,901 |
3.2 |
90,672 |
||||
Liabilities collateralized by existing and anticipated trade receivables |
2,626 |
1,698 |
928 |
n.a. |
1,439 |
||||
Liabilities to banks |
4,353 |
4,414 |
(61) |
(1.4) |
3,310 |
||||
Other financial liabilities |
12,128 |
12,247 |
(119) |
(1.0) |
12,251 |
||||
Lease liabilities |
36,053 |
36,384 |
(331) |
(0.9) |
35,553 |
||||
Financial liabilities and lease liabilities |
150,040 |
146,722 |
3,318 |
2.3 |
143,225 |
||||
Accrued interest |
(1,153) |
(1,197) |
44 |
3.7 |
(1,043) |
||||
Other |
(2,180) |
(1,922) |
(259) |
(13.5) |
(1,924) |
||||
Gross debt |
146,707 |
143,603 |
3,104 |
2.2 |
140,258 |
||||
Cash and cash equivalents |
5,373 |
7,818 |
(2,445) |
(31.3) |
10,441 |
||||
Derivative financial assets |
1,249 |
1,399 |
(150) |
(10.7) |
1,373 |
||||
Other financial assets |
1,698 |
1,868 |
(170) |
(9.1) |
1,908 |
||||
Net debta |
138,387 |
132,518 |
5,869 |
4.4 |
126,535 |
||||
Lease liabilitiesb |
34,035 |
34,451 |
(416) |
(1.2) |
33,553 |
||||
Net debt AL |
104,352 |
98,067 |
6,285 |
6.4 |
92,982 |
||||
|
|||||||||
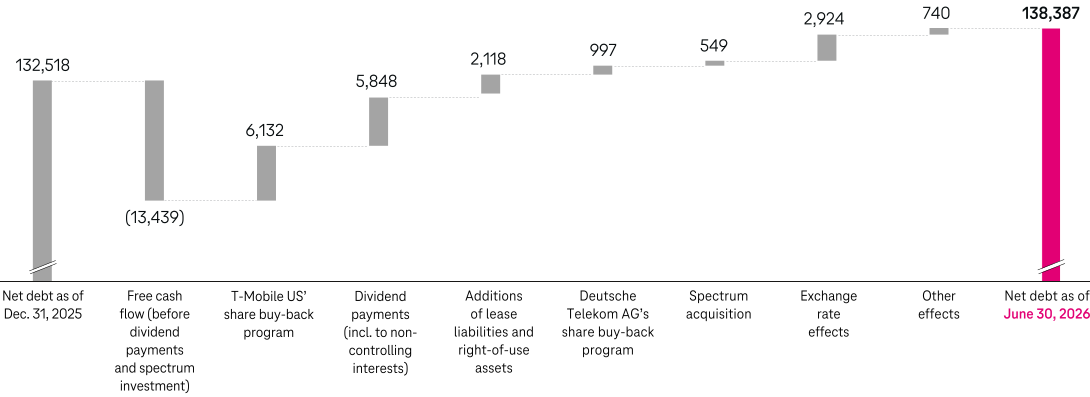
Changes in net debt
millions of €
millions of € |
|
|
|
|
|
|
|
|
||||||
|
H1 2026 |
H1 2025 |
Change |
Q1 2026 |
Q2 2026 |
Q2 2025 |
Change |
FY 2025 |
||||||
|---|---|---|---|---|---|---|---|---|---|---|---|---|---|---|
Net cash from operating activities |
21,117 |
20,939 |
0.9 |
10,875 |
10,242 |
9,767 |
4.9 |
40,627 |
||||||
Cash outflows for investments in intangible assets |
(2,962) |
(3,355) |
11.7 |
(1,289) |
(1,673) |
(2,065) |
19.0 |
(6,942) |
||||||
Cash outflows for investments in property, plant and equipment |
(5,399) |
(5,850) |
7.7 |
(2,641) |
(2,758) |
(2,659) |
(3.7) |
(12,314) |
||||||
Cash capex |
(8,361) |
(9,205) |
9.2 |
(3,930) |
(4,430) |
(4,724) |
6.2 |
(19,256) |
||||||
Spectrum investment |
549 |
992 |
(44.6) |
123 |
426 |
854 |
(50.2) |
1,071 |
||||||
Investments in the acquisition of customer bases |
0 |
0 |
n.a. |
0 |
0 |
0 |
n.a. |
1,322 |
||||||
Cash capex (before spectrum investment)a |
(7,812) |
(8,213) |
4.9 |
(3,807) |
(4,004) |
(3,870) |
(3.5) |
(16,864) |
||||||
Proceeds from the disposal of intangible assets (excluding goodwill) and property, plant and equipment |
133 |
1,907 |
(93.0) |
97 |
36 |
1,878 |
(98.1) |
2,075 |
||||||
Proceeds from the disposal of spectrum |
0 |
(1,777) |
n.a. |
0 |
0 |
(1,777) |
n.a. |
(1,777) |
||||||
Proceeds from the disposal of intangible assets (excluding goodwill and spectrum) and property, plant and equipment |
133 |
130 |
2.7 |
97 |
36 |
101 |
(63.9) |
298 |
||||||
Net cash outflows for investments in intangible assets (excluding goodwill and spectrum) and property, plant and equipmenta |
(7,678) |
(8,083) |
5.0 |
(3,710) |
(3,968) |
(3,769) |
(5.3) |
(16,566) |
||||||
Free cash flow (before dividend payments and spectrum investment)a,b |
13,439 |
12,856 |
4.5 |
7,165 |
6,274 |
5,998 |
4.6 |
24,061 |
||||||
Principal portion of repayment of lease liabilitiesc |
(2,725) |
(2,328) |
(17.0) |
(1,478) |
(1,247) |
(1,120) |
(11.3) |
(4,515) |
||||||
Free cash flow AL (before dividend payments and spectrum investment)a,b |
10,714 |
10,528 |
1.8 |
5,687 |
5,027 |
4,878 |
3.1 |
19,546 |
||||||
|
||||||||||||||
Free cash flow AL (before dividend payments and spectrum investment) increased by EUR 0.2 billion against the prior-year period to EUR 10.7 billion. The following effects impacted on this development:
Net cash from operating activities increased by EUR 0.2 billion to EUR 21.1 billion. The continued strong development of operations was offset by negative exchange rate effects and higher tax and net interest payments. In the United States operating segment, higher cash outflows for the 2025-2026 Workforce Transformation and for integration measures as a result of corporate transactions completed in the prior year (primarily the UScellular Acquisition) also had a negative impact.
Cash capex (before spectrum investment) decreased by EUR 0.4 billion to EUR 7.8 billion. In the Germany operating segment, cash capex totaled EUR 1.8 billion in the reporting period, EUR 0.5 billion less than in the prior-year period. This was primarily due to the timing of the allocation of investments in the fiber build-out. Cash capex in the United States operating segment increased by EUR 0.1 billion year-on-year to EUR 4.6 billion, in particular due to higher investments in the continued network build-out and additional capital expenditure as a result of the UScellular Acquisition. By contrast, exchange rate effects reduced the amount of the cash outflows in the reporting currency. In the Europe operating segment, cash capex decreased slightly against the level of the prior-year period to EUR 0.9 billion. In the Systems Solutions operating segment, cash capex increased slightly year-on-year.
The sale of spectrum licenses by T‑Mobile US to N77 in the prior-year period generated cash proceeds of EUR 1.8 billion. Excluding this transaction, proceeds from the disposal of intangible assets (excluding goodwill and spectrum) and property, plant and equipment stood at the prior-year level.
An increase of EUR 0.4 billion in cash outflows – in particular in the Germany and United States operating segments – for the repayment of lease liabilities reduced free cash flow AL.
For further information, please refer to the section “Notes to the consolidated statement of cash flows” in the interim consolidated financial statements.
|
|
|
|
|
Standard & Poor’s |
Moody’s |
Fitch |
|---|---|---|---|
Long-term rating/outlook |
|
|
|
Dec. 31, 2025 |
BBB+/positive |
A3/stable |
BBB+/stable |
June 30, 2026 |
A-/stable |
A3/stable |
A-/stable |
Short-term rating |
A-2 |
P-2 |
F2 |
On May 11, 2026 and June 22, 2026, the rating agencies Standard & Poorʼs and Fitch raised Deutsche Telekom AG’s credit rating, such that both stood at A- with a stable outlook as of June 30, 2026. As a solid investment-grade company, we have access to the international capital markets.