
Results of operations of the Group
millions of € |
|
|
|
|
|
|
|
|
|
||
|
|
H1 2026 |
H1 2025 |
Change |
Q1 2026 |
Q2 2026 |
Q2 2025 |
Change |
FY 2025 |
||
|---|---|---|---|---|---|---|---|---|---|---|---|
Net revenue |
|
59,804 |
58,427 |
2.4 |
29,870 |
29,933 |
28,671 |
4.4 |
119,081 |
||
Service revenuea |
|
50,445 |
49,067 |
2.8 |
25,039 |
25,406 |
24,237 |
4.8 |
98,854 |
||
EBITDA AL (adjusted for special factors) |
|
23,342 |
22,297 |
4.7 |
11,521 |
11,821 |
10,999 |
7.5 |
44,244 |
||
EBITDA AL |
|
21,710 |
22,015 |
(1.4) |
10,492 |
11,219 |
10,841 |
3.5 |
42,452 |
||
Depreciation, amortization and impairment losses |
|
(12,391) |
(11,777) |
(5.2) |
(6,436) |
(5,955) |
(5,764) |
(3.3) |
(24,009) |
||
Profit (loss) from operations (EBIT) |
|
12,705 |
13,408 |
(5.2) |
5,843 |
6,863 |
6,642 |
3.3 |
24,822 |
||
Profit (loss) from financial activities |
|
(3,235) |
(2,195) |
(47.4) |
(1,611) |
(1,624) |
(1,278) |
(27.1) |
(5,323) |
||
Profit (loss) before income taxes |
|
9,470 |
11,213 |
(15.5) |
4,232 |
5,238 |
5,364 |
(2.3) |
19,499 |
||
Income taxes |
|
(2,525) |
(2,787) |
9.4 |
(1,137) |
(1,389) |
(1,269) |
(9.5) |
(4,573) |
||
Net profit (loss) |
|
4,493 |
5,460 |
(17.7) |
2,043 |
2,450 |
2,615 |
(6.3) |
9,609 |
||
Net profit (loss) (adjusted for special factors) |
|
5,385 |
4,947 |
8.8 |
2,601 |
2,784 |
2,504 |
11.1 |
9,747 |
||
Earnings per share (basic and diluted) |
€ |
0.93 |
1.12 |
(16.6) |
0.42 |
0.51 |
0.54 |
(5.0) |
1.97 |
||
Adjusted earnings per share (basic and diluted) |
€ |
1.12 |
1.01 |
10.3 |
0.54 |
0.58 |
0.51 |
12.7 |
2.00 |
||
|
|||||||||||
In order to increase the informative value of the prior-year comparatives based on changes to the Company’s structure or exchange rate effects, we also describe the change in selected figures in organic terms, by adjusting the figures for the prior-year period for changes in the composition of the Group, exchange rate effects, and other effects. Negative exchange rate effects were primarily attributable to the translation of U.S. dollars to euros. Positive effects of changes in the composition of the Group mainly related to the corporate transactions concluded in the prior year in the United States operating segment (primarily UScellular and Metronet).
Revenue, service revenue
In the first half of 2026, we generated net revenue of EUR 59.8 billion, which was up EUR 1.4 billion or 2.4 % year-on-year. In organic terms, revenue increased by 4.0 % against the prior-year level, with exchange rate effects having a net decreasing effect of EUR 2.5 billion and effects of changes in the composition of the Group an increasing effect of EUR 1.6 billion. Service revenue in the Group increased by EUR 1.4 billion or 2.8 % year-on-year to EUR 50.4 billion. In organic terms, service revenue increased by 3.9 %.
millions of € |
|
|
|
|
|
|
|
|
|
H1 2026 |
H1 2025 |
Change |
Q1 2026 |
Q2 2026 |
Q2 2025 |
Change |
FY 2025 |
|---|---|---|---|---|---|---|---|---|
Germany |
12,846 |
12,505 |
2.7 |
6,340 |
6,507 |
6,286 |
3.5 |
25,610 |
United States |
39,306 |
38,397 |
2.4 |
19,744 |
19,562 |
18,597 |
5.2 |
78,097 |
Europe |
6,253 |
6,170 |
1.3 |
3,089 |
3,164 |
3,116 |
1.5 |
12,652 |
Systems Solutions |
2,102 |
2,023 |
4.0 |
1,026 |
1,077 |
1,013 |
6.2 |
4,103 |
Group Development |
1 |
4 |
(78.9) |
0 |
0 |
2 |
(73.3) |
9 |
Group Headquarters & Group Services |
1,048 |
1,100 |
(4.7) |
524 |
524 |
551 |
(4.8) |
2,163 |
Intersegment revenue |
(1,753) |
(1,771) |
1.0 |
(851) |
(901) |
(894) |
(0.8) |
(3,553) |
Net revenue |
59,804 |
58,427 |
2.4 |
29,870 |
29,933 |
28,671 |
4.4 |
119,081 |
In our domestic market of Germany, revenue increased by 2.7 % year-on-year, mainly due to higher mobile and fixed-network service revenues. Non-service revenues also increased, in part on the back of higher terminal equipment revenues. In our United States operating segment, revenue was up 2.4 % against the prior-year level, with negative exchange rate effects having a strong decreasing effect and the corporate transactions completed in the prior year having an increasing effect. In organic terms, revenue increased by 4.8 %, due to higher service and terminal equipment revenues. In our Europe operating segment, revenue increased by 1.3 % year-on-year. In organic terms, it increased by 1.5 %, due to the increase in service revenues in the IT, mobile, and fixed-network business. Revenue in our Systems Solutions operating segment was up 4.0 % year-on-year, mainly due to growth in the Digital area.
For further information, please refer to the section “Development of business in the operating segments.”
Contribution of the segments to net revenue a, b
%
Breakdown of revenue by region c
%
aFor further information on net revenue, please refer to the section “Segment reporting” in the interim consolidated financial statements.
bFollowing the sale of the GD Towers business entity in the 2023 financial year, the Group Development operating segment no longer provides a significant contribution to net revenue.
cThe calculation of the international share was adjusted effective September 30, 2025. The prior-year comparative was adjusted retrospectively from 77.0 % to 78.0 %.
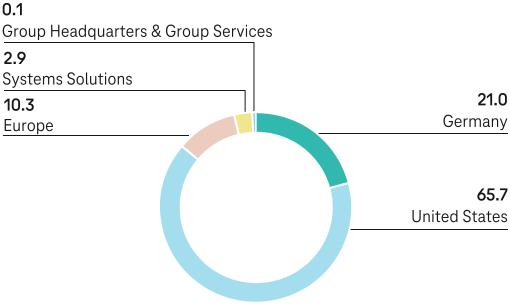
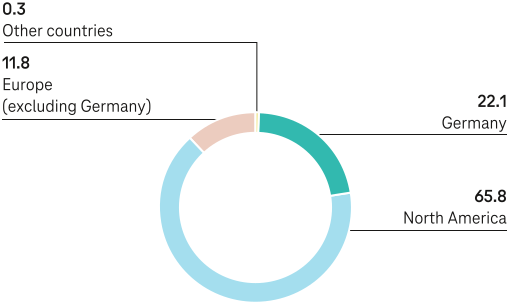
Our United States operating segment made by far the largest contribution to net revenue, with 65.7 % (H1 2025: 65.7 %). The proportion of net revenue generated internationally decreased slightly to 77.9 % (H1 2025: 78.0 %) c.
Adjusted EBITDA AL, EBITDA AL
In the first half of 2026, we generated adjusted EBITDA AL of EUR 23.3 billion, which was up 4.7 % or EUR 1.0 billion year-on-year. In organic terms, adjusted EBITDA AL increased by 7.4 %, with exchange rate effects having a net decreasing effect of EUR 0.9 billion and changes in the composition of the Group having a positive effect of EUR 0.4 billion.
millions of € |
|
|
|
|
|
|
|
|
|
H1 2026 |
H1 2025 |
Change |
Q1 2026 |
Q2 2026 |
Q2 2025 |
Change |
FY 2025 |
|---|---|---|---|---|---|---|---|---|
Germany |
5,371 |
5,239 |
2.5 |
2,699 |
2,672 |
2,605 |
2.6 |
10,694 |
United States |
15,707 |
14,922 |
5.3 |
7,738 |
7,969 |
7,299 |
9.2 |
29,252 |
Europe |
2,451 |
2,310 |
6.1 |
1,196 |
1,255 |
1,170 |
7.3 |
4,677 |
Systems Solutions |
183 |
176 |
3.8 |
84 |
99 |
96 |
3.7 |
427 |
Group Development |
(15) |
(18) |
18.4 |
(6) |
(9) |
(10) |
15.1 |
(34) |
Group Headquarters & Group Services |
(349) |
(323) |
(8.1) |
(185) |
(164) |
(157) |
(4.4) |
(768) |
Reconciliation |
(6) |
(9) |
34.3 |
(4) |
(2) |
(2) |
13.7 |
(3) |
EBITDA AL (adjusted for special factors) |
23,342 |
22,297 |
4.7 |
11,521 |
11,821 |
10,999 |
7.5 |
44,244 |
Our Germany operating segment contributed to the increase thanks to high-value service revenue growth and improved cost efficiency with 2.5 % higher adjusted EBITDA AL. Adjusted EBITDA AL in our United States operating segment increased by 5.3 %. In organic terms, it increased by 9.6 %. This rise is primarily attributable to higher service and terminal equipment revenues, offset by increases in some costs. In our Europe operating segment, adjusted EBITDA AL increased by 6.1 %. In organic terms, it increased by 3.8 %, mainly on the back of the strong operational revenue trend as well as a positive net margin. Adjusted EBITDA AL also increased by 3.8 % in our Systems Solutions operating segment, mainly due to revenue growth and enhanced efficiency in the Digital area.
Our EBITDA AL decreased by EUR 0.3 billion year-on-year to EUR 21.7 billion. This was primarily due to expenses from special factors affecting EBITDA AL, which increased by EUR 1.4 billion against the prior-year period to EUR 1.6 billion, with expenses incurred in connection with staff restructuring increasing by EUR 0.5 billion year-on-year, primarily in connection with the 2025-2026 Workforce Transformation at T‑Mobile US. Expenses recognized as a special factor under effects of deconsolidations, disposals, and acquisitions increased by EUR 0.1 billion. These mainly related to integration expenses arising from the UScellular Acquisition in the United States operating segment in the prior year. Depreciation of and impairment losses on right-of-use assets recognized as a special factor increased by EUR 0.3 billion. This was the result of integration measures, primarily arising from accelerated depreciation of certain assets assumed in connection with the UScellular Acquisition by T‑Mobile US. Other special factors affecting EBITDA AL changed from EUR 0.2 billion to EUR ‑0.3 billion. They include expenses for network restructuring measures and retail initiatives at T‑Mobile US. In the prior-year period, in addition to the income from the sale of spectrum licenses to N77, they included legal-related insurance recoveries in relation to the cyberattack on T‑Mobile US in August 2021.
For further information, please refer to the section “Development of business in the operating segments.”
Profit/loss from operations (EBIT)
Group EBIT decreased to EUR 12.7 billion, down EUR 0.7 billion against the level of the prior-year period. This decrease is due in part to the effects described under EBITDA AL.
Higher depreciation, amortization and impairment losses on intangible assets, property, plant and equipment and right-of-use assets in the first half of 2026, which increased by EUR 0.6 billion to EUR 12.4 billion, mainly due to higher depreciation and amortization in the United States operating segment, also decreased Group EBIT. This resulted from non-current assets assumed in connection with the UScellular Acquisition and the correspondingly higher depreciation base as well as the continued build-out of the 5G network. Depreciation and amortization also increased in the United States operating segment due to accelerated depreciation of certain network and technology assets. This accelerated depreciation resulted from integration and restructuring activities and mainly related to assets assumed in connection with the UScellular Acquisition.
Profit before income taxes
Profit before income taxes decreased by EUR 1.7 billion to EUR 9.5 billion. Loss from financial activities included in this increased year-on-year by EUR 1.0 billion to EUR 3.2 billion, due to the EUR 1.0 billion decrease in the profit from associates and joint ventures included in the consolidated financial statements using the equity method. This was primarily attributable to reversals of impairment losses recognized in the prior-year period of EUR 0.5 billion and EUR 0.2 billion, respectively, on the carrying amounts of the investments in GD Towers and in GlasfaserPlus. Furthermore, the share of profit of associates and joint ventures accounted for using the equity method was reduced by proportionate losses from T‑Mobile US’ investments in Metronet and Lumos. Finance costs and other financial income/expense remained more or less stable.
Net profit, adjusted net profit
Net profit decreased year-on-year by EUR 1.0 billion to EUR 4.5 billion. The tax expense decreased by EUR 0.3 billion to EUR 2.5 billion. Profit attributable to non-controlling interests decreased by EUR 0.5 billion to EUR 2.5 billion. This decline was primarily attributable to the United States operating segment. Adjusted net profit amounted to EUR 5.4 billion compared with EUR 4.9 billion in the prior-year period.
For further information on tax expense, please refer to the section “Income taxes” in the interim consolidated financial statements.
Earnings per share, adjusted earnings per share
Earnings per share is calculated as net profit divided by the weighted average number of ordinary shares outstanding, which totaled 4,822 million as of June 30, 2026. This resulted in earnings per share of EUR 0.93, down from EUR 1.12 in the prior-year period. Adjusted earnings per share amounted to EUR 1.12 compared with EUR 1.01 in the prior-year period.
Reconciliations of financial performance indicators from the IFRS consolidated financial statements
A reconciliation of the definition of EBITDA to the “after leases” indicator (EBITDA AL) can be found in the following table:
millions of € |
|
|
|
|
|
|
|
|
||
|
H1 2026 |
H1 2025 |
Change |
Q1 2026 |
Q2 2026 |
Q2 2025 |
Change |
FY 2025 |
||
|---|---|---|---|---|---|---|---|---|---|---|
EBITDA |
25,096 |
25,184 |
(0.4) |
12,278 |
12,818 |
12,406 |
3.3 |
48,831 |
||
Depreciation of right-of-use assetsa |
(2,568) |
(2,322) |
(10.6) |
(1,379) |
(1,189) |
(1,151) |
(3.2) |
(4,689) |
||
Interest expenses on recognized lease liabilitiesa |
(817) |
(847) |
3.5 |
(407) |
(410) |
(413) |
0.6 |
(1,691) |
||
EBITDA AL |
21,710 |
22,015 |
(1.4) |
10,492 |
11,219 |
10,841 |
3.5 |
42,452 |
||
Special factors affecting EBITDA AL |
(1,632) |
(282) |
n.a. |
(1,030) |
(603) |
(158) |
n.a. |
(1,792) |
||
EBITDA AL (adjusted for special factors) |
23,342 |
22,297 |
4.7 |
11,521 |
11,821 |
10,999 |
7.5 |
44,244 |
||
|
||||||||||
The following table presents the reconciliation of net profit to net profit adjusted for special factors:
millions of € |
|
|
|
|
|
|
|
|
|
H1 2026 |
H1 2025 |
Change |
Q1 2026 |
Q2 2026 |
Q2 2025 |
Change |
FY 2025 |
|---|---|---|---|---|---|---|---|---|
Net profit (loss) |
4,493 |
5,460 |
(17.7) |
2,043 |
2,450 |
2,615 |
(6.3) |
9,609 |
Special factors affecting EBITDA AL |
(1,632) |
(282) |
n.a. |
(1,030) |
(603) |
(158) |
n.a. |
(1,792) |
Staff-related measures |
(830) |
(348) |
n.a. |
(535) |
(295) |
(176) |
(67.2) |
(1,099) |
Non-staff-related restructuring |
(10) |
(27) |
64.9 |
(4) |
(6) |
(20) |
72.3 |
(57) |
Effects of deconsolidations, disposals and acquisitions |
(224) |
(88) |
n.a. |
(110) |
(114) |
(65) |
(73.9) |
(405) |
Depreciation and impairment losses on |
(295) |
(23) |
n.a. |
(251) |
(44) |
(23) |
n.a. |
(47) |
Reversals of impairment losses |
0 |
0 |
n.a. |
0 |
0 |
0 |
n.a. |
0 |
Other |
(274) |
204 |
n.a. |
(130) |
(144) |
126 |
n.a. |
(184) |
Special factors affecting net profit |
741 |
795 |
(6.8) |
472 |
269 |
268 |
0.4 |
1,653 |
Depreciation, amortization and impairment losses |
(294) |
(17) |
n.a. |
(257) |
(37) |
(17) |
n.a. |
(119) |
Profit (loss) from financial activities |
0 |
798 |
n.a. |
1 |
(2) |
197 |
n.a. |
794 |
Income taxes |
507 |
(11) |
n.a. |
341 |
166 |
66 |
n.a. |
633 |
Non-controlling interests |
528 |
26 |
n.a. |
386 |
143 |
23 |
n.a. |
345 |
Special factors |
(891) |
513 |
n.a. |
(558) |
(333) |
110 |
n.a. |
(139) |
Net profit (loss) (adjusted for special factors) |
5,385 |
4,947 |
8.8 |
2,601 |
2,784 |
2,504 |
11.1 |
9,747 |
The following table presents a reconciliation of EBITDA AL, EBIT, and net profit to the respective figures adjusted for special factors:
millions of € |
|
|
|
|
|
|
|
EBITDA AL |
EBIT |
EBITDA AL |
EBIT |
EBITDA AL |
EBIT |
|---|---|---|---|---|---|---|
EBITDA AL/EBIT |
21,710 |
12,705 |
22,015 |
13,408 |
42,452 |
24,822 |
Germany |
(241) |
(241) |
(159) |
(159) |
(466) |
(466) |
Staff-related measures |
(234) |
(234) |
(165) |
(165) |
(440) |
(440) |
Non-staff-related restructuring |
(7) |
(7) |
(3) |
(3) |
(13) |
(13) |
Effects of deconsolidations, disposals and acquisitions |
0 |
0 |
0 |
0 |
(20) |
(20) |
Depreciation, amortization and impairment losses |
0 |
0 |
0 |
0 |
0 |
0 |
Reversals of impairment losses |
0 |
0 |
0 |
0 |
0 |
0 |
Other |
(1) |
(1) |
9 |
9 |
7 |
7 |
United States |
(1,180) |
(1,459) |
8 |
22 |
(917) |
(988) |
Staff-related measures |
(427) |
(427) |
(47) |
(47) |
(288) |
(288) |
Non-staff-related restructuring |
0 |
0 |
(24) |
(9) |
(41) |
(17) |
Effects of deconsolidations, disposals and acquisitions |
(220) |
(220) |
(133) |
(133) |
(417) |
(417) |
Depreciation, amortization and impairment losses |
(295) |
(574) |
0 |
0 |
(20) |
(115) |
Reversals of impairment losses |
0 |
0 |
0 |
0 |
0 |
0 |
Other |
(239) |
(239) |
212 |
212 |
(151) |
(151) |
Europe |
(57) |
(57) |
(58) |
(76) |
(124) |
(146) |
Staff-related measures |
(37) |
(37) |
(35) |
(35) |
(66) |
(66) |
Non-staff-related restructuring |
0 |
0 |
0 |
0 |
0 |
0 |
Effects of deconsolidations, disposals and acquisitions |
0 |
0 |
4 |
4 |
(20) |
(20) |
Depreciation, amortization and impairment losses |
0 |
0 |
(23) |
(40) |
(27) |
(50) |
Reversals of impairment losses |
0 |
0 |
0 |
0 |
0 |
0 |
Other |
(20) |
(20) |
(4) |
(4) |
(10) |
(10) |
Systems Solutions |
(53) |
(53) |
(51) |
(51) |
(175) |
(175) |
Staff-related measures |
(36) |
(36) |
(36) |
(36) |
(150) |
(150) |
Non-staff-related restructuring |
0 |
0 |
0 |
0 |
0 |
0 |
Effects of deconsolidations, disposals and acquisitions |
(1) |
(1) |
0 |
0 |
5 |
5 |
Depreciation, amortization and impairment losses |
0 |
0 |
0 |
0 |
0 |
0 |
Reversals of impairment losses |
0 |
0 |
0 |
0 |
0 |
0 |
Other |
(17) |
(17) |
(14) |
(14) |
(29) |
(29) |
Group Development |
(5) |
(5) |
36 |
36 |
35 |
35 |
Staff-related measures |
0 |
0 |
1 |
1 |
1 |
1 |
Non-staff-related restructuring |
0 |
0 |
0 |
0 |
0 |
0 |
Effects of deconsolidations, disposals and acquisitions |
(5) |
(5) |
35 |
35 |
34 |
34 |
Depreciation, amortization and impairment losses |
0 |
0 |
0 |
0 |
0 |
0 |
Reversals of impairment losses |
0 |
0 |
0 |
0 |
0 |
0 |
Other |
0 |
0 |
0 |
0 |
0 |
0 |
Group Headquarters & Group Services |
(95) |
(95) |
(57) |
(57) |
(146) |
(146) |
Staff-related measures |
(97) |
(97) |
(65) |
(65) |
(155) |
(155) |
Non-staff-related restructuring |
(3) |
(3) |
0 |
0 |
(2) |
(2) |
Effects of deconsolidations, disposals and acquisitions |
2 |
2 |
7 |
7 |
13 |
13 |
Depreciation, amortization and impairment losses |
0 |
0 |
0 |
0 |
0 |
0 |
Reversals of impairment losses |
0 |
0 |
0 |
0 |
0 |
0 |
Other |
2 |
2 |
1 |
1 |
(1) |
(1) |
Group |
(1,632) |
(1,911) |
(282) |
(285) |
(1,792) |
(1,886) |
Staff-related measures |
(830) |
(830) |
(348) |
(348) |
(1,099) |
(1,099) |
Non-staff-related restructuring |
(10) |
(10) |
(27) |
(13) |
(57) |
(33) |
Effects of deconsolidations, disposals and acquisitions |
(224) |
(224) |
(88) |
(88) |
(405) |
(405) |
Depreciation, amortization and impairment losses |
(295) |
(574) |
(23) |
(40) |
(47) |
(165) |
Reversals of impairment losses |
0 |
0 |
0 |
0 |
0 |
0 |
Other |
(274) |
(274) |
204 |
204 |
(184) |
(184) |
EBITDA AL/EBIT (adjusted for special factors) |
23,342 |
14,616 |
22,297 |
13,693 |
44,244 |
26,708 |
Profit (loss) from financial activities (adjusted for special factors) |
|
(3,220) |
|
(2,978) |
|
(6,092) |
Profit (loss) before income taxes (adjusted for special factors) |
|
11,396 |
|
10,715 |
|
20,616 |
Income taxes (adjusted for special factors) |
|
(3,032) |
|
(2,776) |
|
(5,206) |
Profit (loss) (adjusted for special factors) |
|
8,365 |
|
7,939 |
|
15,410 |
Profit (loss) (adjusted for special factors) attributable to |
|
|
|
|
|
|
Owners of the parent (net profit (loss)) (adjusted for special factors) |
|
5,385 |
|
4,947 |
|
9,747 |
Non-controlling interests (adjusted for special factors) |
|
2,980 |
|
2,992 |
|
5,662 |